Automated Crypto Visualization with the New Web Scraper Cloud Data Export Feature
June 14, 2021
Automated data export to Google Sheets, Visualize scraped data in Google Sheets, How to append Web Scraper data to Google Sheets, Automatic updating of scraped data in spreadsheets, Google Append feature for cloud data export, Scheduler-enabled Google Sheets export for automation, Create dynamic charts from Web Scraper data, Export and visualize cryptocurrency data automatically, Streamline data visualization with automated Google Sheets, Google Sheets integration for Web Scraper Cloud
Most people could agree that observing a picture, a simple graph, or a pie chart is easier and more efficient than scrolling through blocks of text or trying to parse out useful insights from looking at numerous columns in a spreadsheet. This common knowledge is the basis of why visualisation is so important.
Also, in a rapidly changing world, people seek ways of becoming more efficient, ways of increasing the time spent focusing on the insights, rather than pouring endless hours and effort into collecting the necessary assets to gain those end results that determine so much. This is why automation nowadays is a key topic.
Now, we are happy to introduce our newest feature that combines the two - automatization and visualisation. The Google Append feature is a data export feature that, when enabled, transfers all the data of your Web Scraper Cloud jobs to a specific folder and individual Google Sheets in your Google Drive account.
If for any scraping job the Scheduler is enabled, the updated data will automatically be exported to your Google Drive. And since now you are able to access all of your data there, this adds the possibility of visualising your scraped data on the spot.
The feature is available for all Web Scraper Cloud users.
To access the Google Append feature, log in to your Web Scraper Cloud account, go to the “Data Export” section of the left menu.

Toolbar-Right-Data-Export- Google-Append-Web-Scraper-Cloud-Feature
There you will see the “Google Sheets” data export option. To link your Web Scraper account with your Google Drive account, click on the Google button.

Link-Google-Sheets-Google-Append-Web-Scraper-Cloud-Feature
Firstly, it will ask to choose which account to link with. Click on the email from the list that you will want the Web Scraper job folder to be in.

Sign-In-Google-Append-Web-Scraper-Feature-Blog
After, Google will ask you to agree to allow webscraper.io to access your Google Account. Keep in mind, this is only necessary for us to create a separate folder in your Google Drive for your scraping jobs to be exported to. We have no further access to anything except the mentioned folder.

Allow-Access-Google-Append-Account-Web-Scraper-Feature-Blog
Once that is done, the green label “Enabled” signifies that the connection between the two servers has been created and that the exporting has begun. At any time, you can preview the stats of how many jobs have gone through, and how much Google Drive storage is available and needed.

Google-Append-Enabled-Web-Scraper-Feature-Blog
Also, for Google Sheets data export, you can choose between the two settings of how you would rather have your data transferred. Either have the old data overwritten with the new every time, or allow the new data to be added to the end of the sheet.
To understand which setting should be chosen, you need to figure out the usage for the majority of your data. If, for example, over-time statistics are needed, then the best way of achieving this is to use the append option so the newly scraped data is appended to the existing data; however, if you are looking at the current data, then overwriting it might be more efficient. Also, for scraping jobs to get appended at the end of the existing sheet, it increases the need for Google Drive storage.

Google-Sheets-Export-Settings-Web-Scraper-Cloud-Feature-Blog-1

Google-Sheets-Export-Settings-Web-Scraper-Cloud-Feature-Blog-2
Once the stats show that the data of your Web Scraper Cloud jobs have been exported and you have adjusted the settings, you can view the Web Scraper folder in your Google Drive account.

Google-Drive-Web-Scraper-Folder-Feature-Blog
For each job, a separate folder is created in which a spreadsheet of the data from the specific scraping job is collected.

Google-Drive-Web-Scraper-Folder-Scraped-Cryptocurrency-Crypto-Data-Feature-Blog
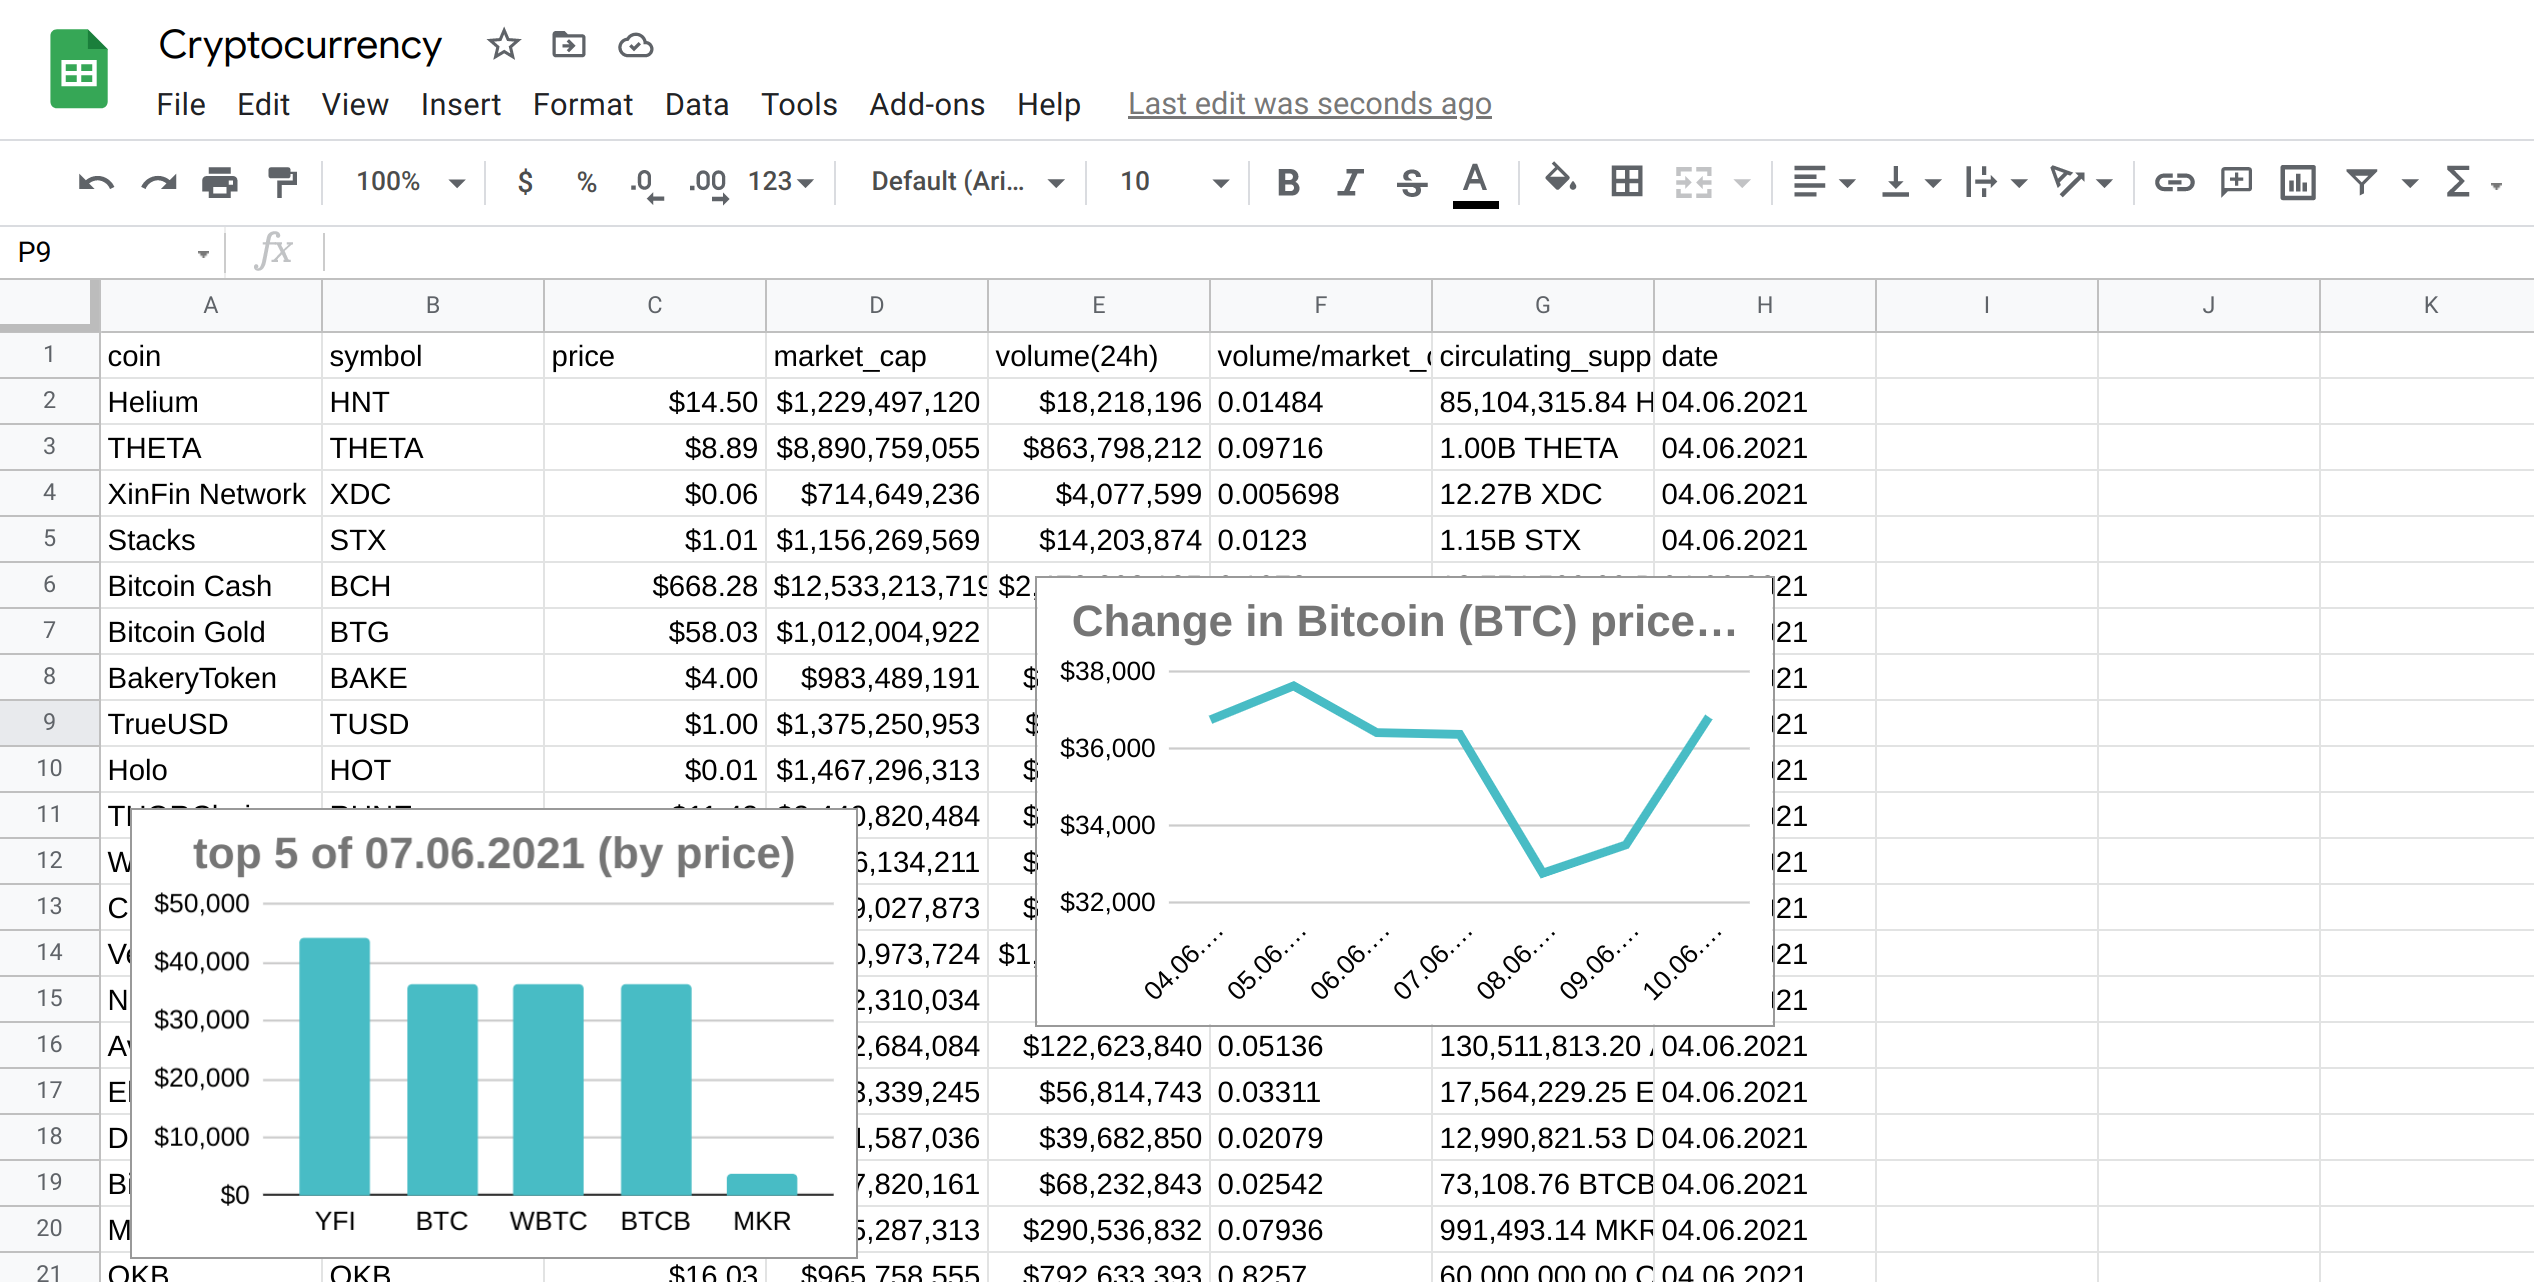
For showcasing an example, we scheduled a scraping job to collect data of different cryptocurrencies - their prices, market capitalisation, volume, etc. Then we enabled the Google Append data export, and for the settings, we chose to have the data be appended at the end of the sheet since our goal is to create various graphs that would visualise the insights needed.
Since we enabled the Scheduler, our sheet will automatically update once the data is scraped without the need to log in to Web Scraper Cloud. However, with a few simple query functions, we are also able to create visualisations like histograms, line charts, pie charts, etc., that will also update automatically once data is updated.
Now that is all the work needed to have the data collected automatically in Google Drive, and to have visual insights into your gathered data, also automated.
These are the graphs that we created:

Change-In-Bitcoin-Price-Cryptocurrency-Crypto-Google-Append-Web-Scraper-Cloud-Feature-Blog

Bitcoin-Market-Cap-Overtime-Cryptocurrency-Crypto-Google-Append-Data-Export-Web-Scraper-Feature-Blog

Top-5-Based-On-Price-Cryptocurrencies-Crypto-Google-Append-Web-Scraper-Cloud-Feature-Blog
The best part is that the graphs created to show the over-time changes will update automatically when additional data is scraped based on the times we have scheduled the job to run; therefore, there is no need for any additional manual input.
Also, the graphs and the insights we have chosen to show are simple and almost primitive; however, the limits of visualisation possibilities are as big as Google Sheets allows; therefore, for more serious data and insights, various graphs are available to suit each case independently.
Start using the new data export feature now and have the data working for you!
Happy scraping!