When browser rendering becomes a scaling bottleneck
September 17, 2026
headless browsers, Web Scraper Cloud, Scaling, Web scraping performance, FullJS
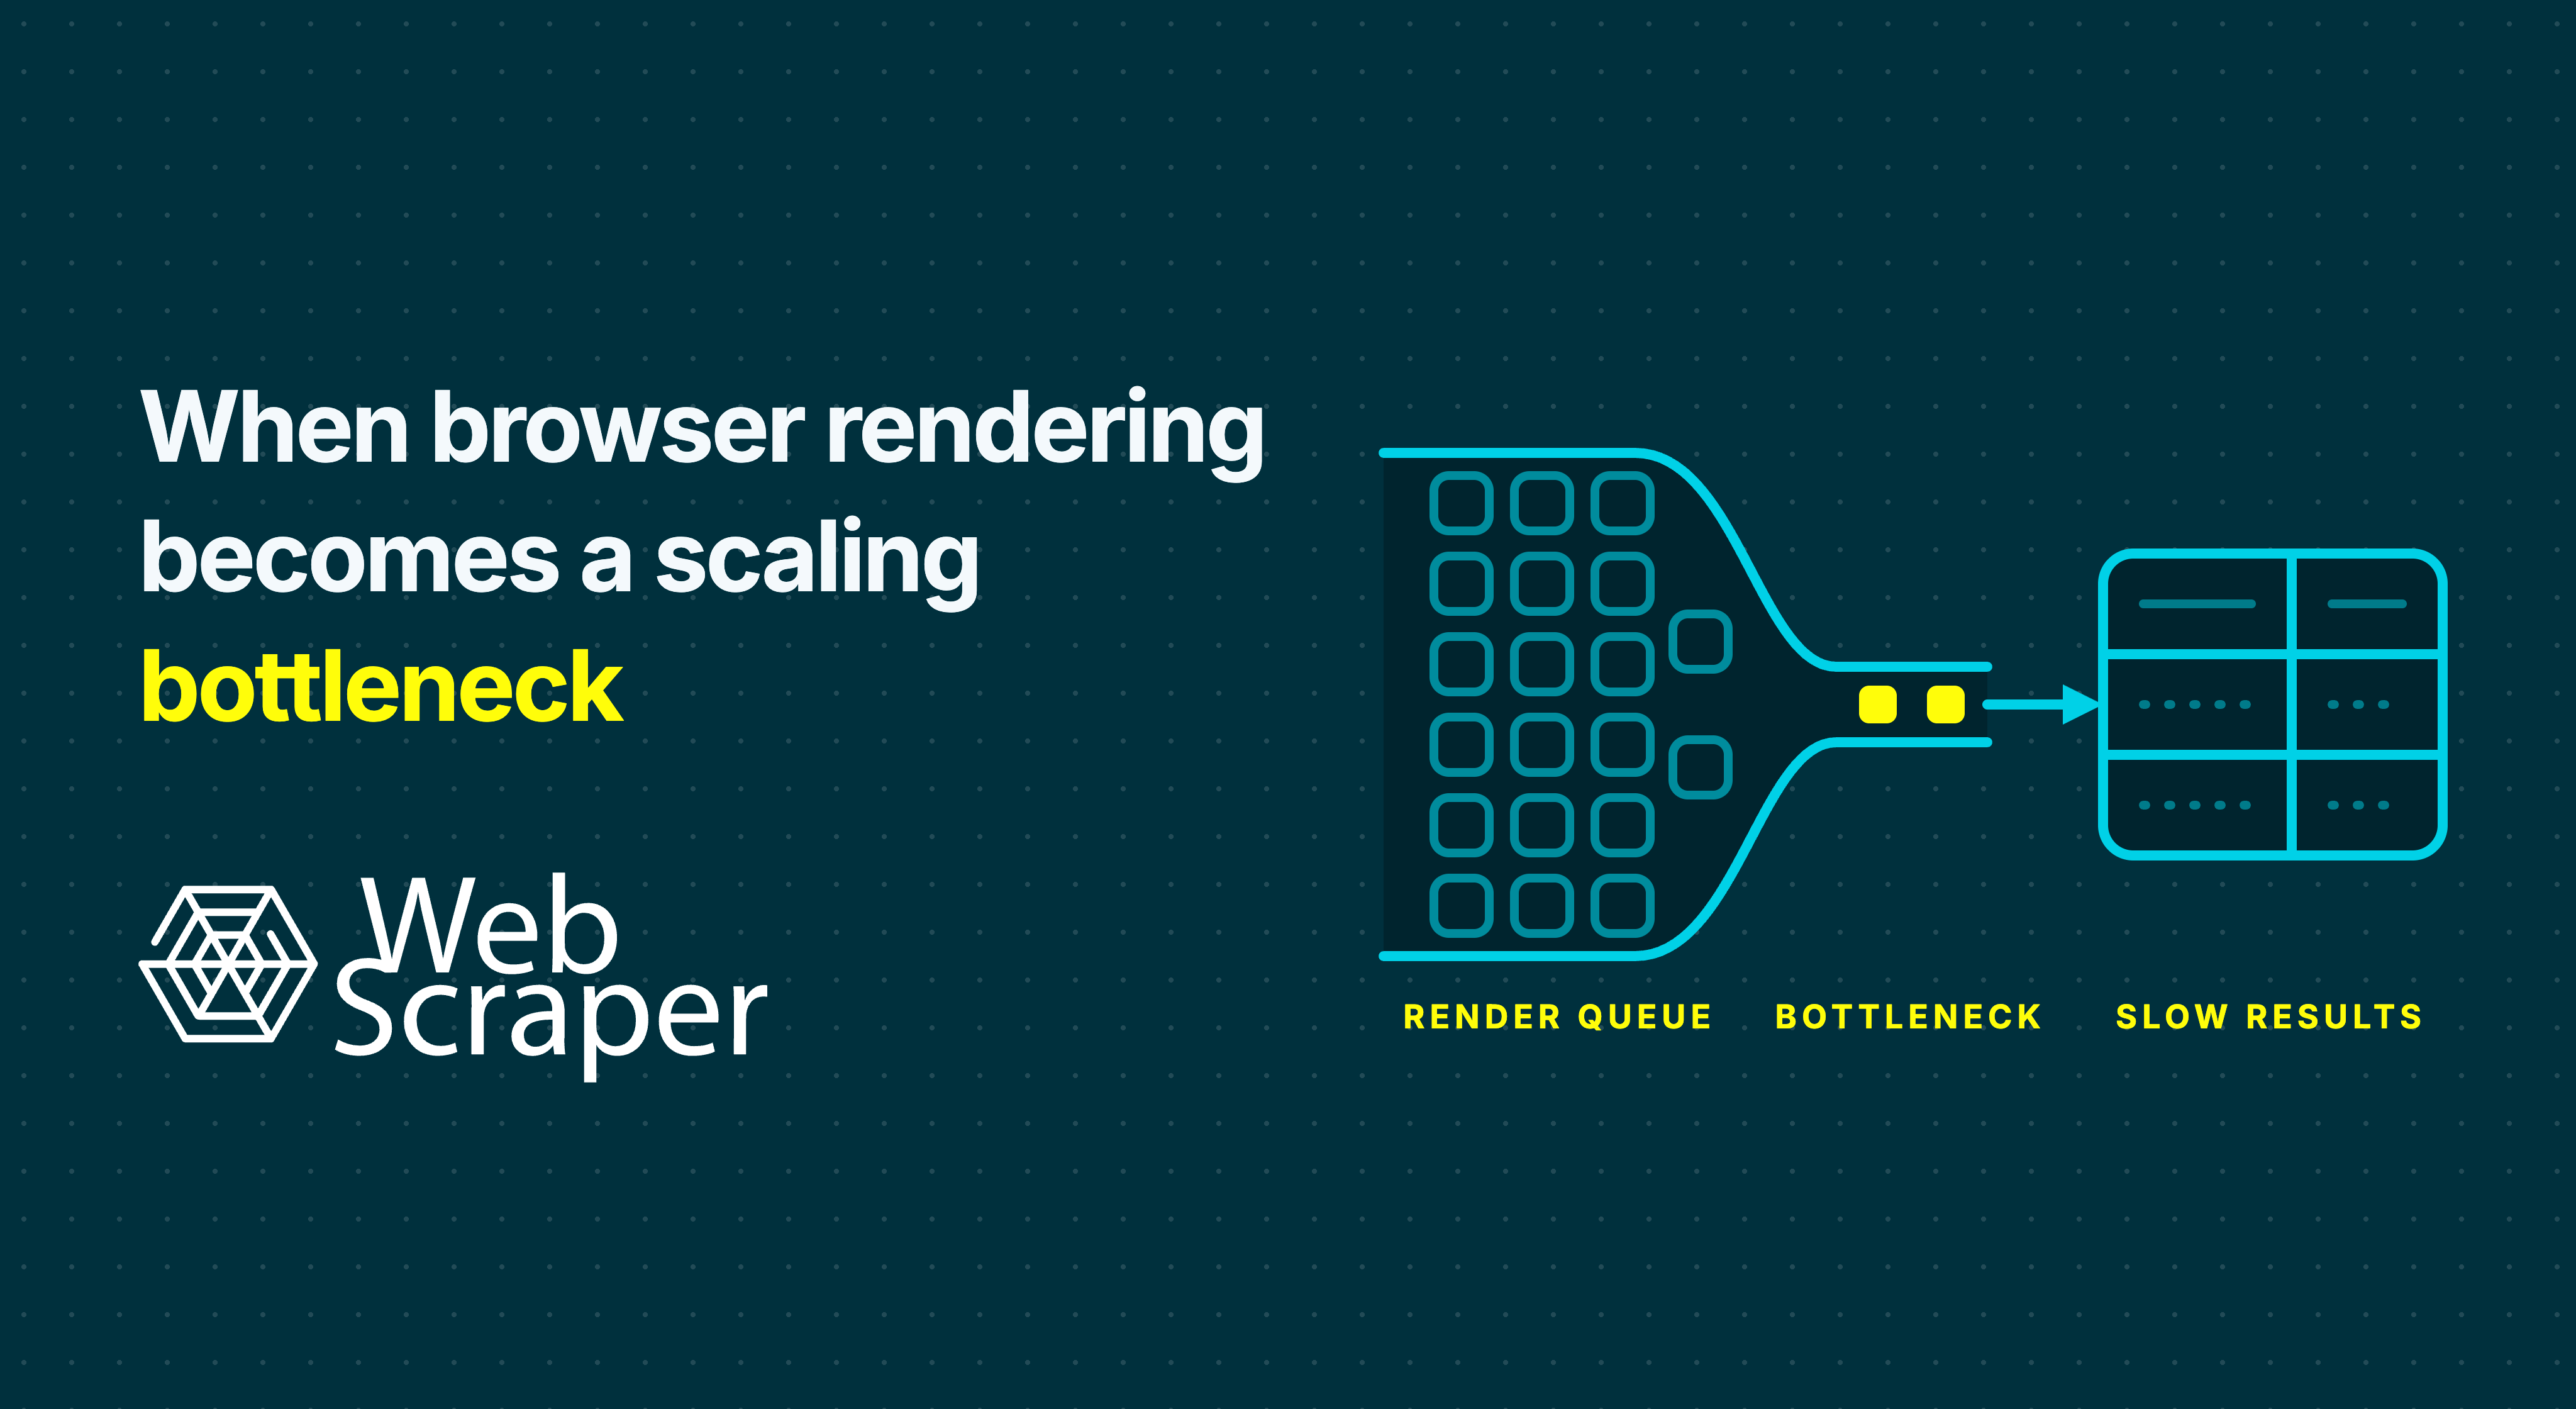
Browser rendering becomes the scaling bottleneck when the browser stage cannot turn queued URLs into validated pages as quickly as the rest of the scraping pipeline can supply and process them. At that point, adding more work increases queueing, page latency, retries or failures without producing a proportional increase in accepted data.
The solution is not automatically more browser concurrency. First prove which stage is saturated, calculate capacity from accepted output and remove browser work that the dataset does not require.
What a rendering bottleneck actually means
A scraping pipeline normally contains several distinct stages:
- Discover and queue URLs.
- Retrieve the initial response.
- Render the page and execute JavaScript when required.
- Perform clicks, scrolling or other interactions.
- Extract records.
- Validate, store and export the dataset.
Rendering is the bottleneck when its sustainable throughput is lower than the arrival rate from the URL queue and the capacity of the downstream stages.
Typical symptoms include:
- the browser queue grows while extraction and storage remain underused;
- increasing simultaneous browser pages produces little additional accepted throughput;
- median and tail page times rise as concurrency increases;
- CPU, memory pressure, browser crashes or navigation timeouts increase;
- retries occupy an increasing share of browser capacity; and
- HTTP-compatible work continues normally while browser-dependent work falls behind.
A slow job does not prove that rendering is responsible. The target website may be responding slowly, rate limiting requests or returning access pages. Alternatively, rendering may finish normally while parsing, database writes or exports create the backlog.
Separate rendering from the other possible constraints
Use evidence from several layers before changing capacity.
| Observation | More likely constraint |
|---|---|
429 or 503 responses increase for one target as its request rate rises |
Target-side rate or overload limit |
| Response waiting dominates while local browser resources remain available | Network, proxy or target response time |
| CPU and memory pressure rise across unrelated targets as browser concurrency increases | Browser execution capacity |
| Browser completion stays stable but records wait for parsing, validation or storage | Downstream processing |
| Only interactive or client-rendered page types accumulate in the queue | Rendering or interaction workflow |
| More concurrency raises timeouts and retries without raising accepted pages per hour | Saturated browser pool |
| Returned pages are fast but contain challenges, consent screens or empty shells | Access or page-state problem, not necessarily rendering capacity |
A page returning 200 OK may still be the wrong page. Before classifying a timeout, empty result or low record count as a capacity problem, follow the 200 OK but no data diagnostic process.
Measure the complete browser residence time
Navigation time alone does not describe the cost of a rendered page.
Modern applications can continue fetching data and changing the interface after the document’s load event. Playwright’s navigation documentation explicitly notes that there is no universal moment when a modern page is fully loaded. Readiness depends on the application and the state the workflow needs.
Measure the browser stage as a sequence:
| Measurement | What it reveals |
|---|---|
| Queue wait | Whether demand exceeds available capacity |
| Browser acquisition time | Whether pages are waiting for an execution slot |
| Navigation time | Time until the initial document reaches the chosen navigation condition |
| Data-readiness time | Additional time until required records are valid |
| Interaction time | Cost of scrolling, clicking, filtering or selecting variants |
| Extraction time | Time spent querying and serialising the final DOM |
| Cleanup time | Cost of closing or resetting the page or session |
| Total browser occupancy | How long constrained browser capacity remains assigned |
| Validation result | Whether the occupied time produced acceptable data |
The browser’s Navigation Timing API can expose document-level milestones such as response completion, DOM readiness and the load event. Add application-specific timestamps for the required data state because navigation metrics cannot prove that a product price, listing count or selected variant is ready.
Track percentiles rather than averages alone. Averages can hide a small population of very slow pages that occupies a disproportionate amount of browser capacity.
Useful measures include:
- median, p90 and p95 browser occupancy;
- accepted rendered pages per hour;
- attempts per accepted page;
- timeout, crash, failed-page and empty-page rates;
- required-field completion;
- queue age by target and page type; and
- cost per accepted page or validated record.
Calculate capacity from accepted output
For capacity planning, measure how much browser time is consumed for each accepted page:
browser slot-seconds per accepted page =
  total browser occupancy seconds across all attempts
  / accepted rendered pages
This includes time spent on failed attempts and retries. A workflow that renders quickly but requires frequent retries may consume more capacity than a slower, reliable workflow.
A simplified planning estimate is:
accepted pages per hour =
  browser slots × 3,600 × planned utilisation
  / browser slot-seconds per accepted page
Suppose a system has eight browser slots, plans to use no more than 75% of theoretical capacity and consumes 15 browser slot-seconds per accepted page:
8 × 3,600 × 0.75 / 15 = 1,440 accepted pages per hourReaching 2,000 accepted pages per hour would require approximately 12 equivalent slots at the same efficiency, or a reduction to about 10.8 slot-seconds per accepted page with the existing eight slots.
This is a planning model, not a universal browser benchmark. Real capacity is also constrained by target request policies, page mix, session requirements, proxies, retries and downstream processing.
Find the saturation point with a stepped load test
Test a representative mixture of page types rather than repeating one unusually simple URL. Keep per-target request limits, proxy policy, validation rules and the software version constant.
Run the workload at gradually increasing browser concurrency and record:
- accepted pages per hour;
- median and p95 browser occupancy;
- timeout and invalid-page rates;
- CPU, memory and process restarts for self-managed infrastructure;
- queue age; and
- downstream processing lag.
An illustrative result might look like this:
| Simultaneous browser pages | p95 browser time | Accepted pages/hour | Invalid or timed-out pages |
|---|---|---|---|
| 2 | 14 seconds | 540 | 0.8% |
| 4 | 15 seconds | 1,010 | 1.0% |
| 8 | 21 seconds | 1,680 | 2.4% |
| 12 | 43 seconds | 1,740 | 7.1% |
The extra four pages between eight and twelve add little useful throughput while doubling tail latency and almost tripling the invalid-page rate. Eight is near the practical knee for this particular environment and workload.
Do not copy these thresholds into another project. The purpose of the test is to identify where your accepted throughput stops scaling proportionally.
Google SRE’s guidance on cascading failures explains why overload can reduce useful work: slower requests remain in flight longer, consume more resources, miss deadlines and trigger retries that add further load.
Check whether the browser is doing unnecessary work
The largest improvement often comes from keeping pages out of the browser path.
A website can use JavaScript without requiring browser rendering for your dataset. Compare the original response with the live DOM and determine where every required field and discovery link first becomes available.
Use a lighter retrieval path when:
- the initial HTML contains the complete required record;
- ordinary links expose the required pagination or detail pages;
- no click, scroll or page-state setup changes the required data; and
- the output remains complete under representative validation.
Use browser rendering when JavaScript or interaction must create the required state. The diagnostic process is covered in browser automation versus HTTP scraping and how JavaScript-rendered content affects web scraping.
Do not route every failed lightweight request into a browser automatically. A browser will not repair an invalid URL, blocked route, broken selector or rejected page.
Split mixed workloads by page type
One website does not necessarily require one execution method.
A category page may need scrolling to discover product URLs, while the product pages return complete server-rendered HTML. A property-search page may need a browser to establish location and filters, while each property detail page can use the lighter route.
Separating these stages prevents the browser-dependent minority from defining the cost and throughput of the complete dataset.
A dependable split needs:
- a stable identifier shared between routes;
- explicit ownership of each field;
- route and page-state provenance;
- deduplication rules at the join point;
- separate failure and quality metrics; and
- validation when two routes should produce the same value.
This is narrower than the broader architecture covered in scaling web scraping from thousands to millions of pages. Here, the goal is specifically to minimise browser residence time without changing the dataset’s meaning.
Reduce the time each required browser page occupies
After confirming that a page genuinely requires rendering, inspect where its browser time is spent.
Replace generic waits with required-state checks
A fixed delay holds capacity whether the data became ready earlier or never arrived.
Where the tooling supports it, prefer a bounded condition connected to the dataset:
- a required field contains a valid value;
- the selected variant matches the requested variant;
- a loading indicator has disappeared;
- a result count has reached the expected boundary;
- a supporting response has completed; or
- another click or scroll no longer adds records.
Do not optimise away necessary waiting. Extracting a placeholder price more quickly is not a throughput improvement.
Remove interactions that do not affect output
Only reproduce actions that create required records or fields. Decorative carousels, analytics widgets, optional tabs and unrelated page components should not extend the workflow.
Review every click, scroll and delay against a specific data requirement.
Bound expanding workflows
Infinite scroll, Load more controls and variant combinations can create open-ended browser sessions.
Define stopping rules such as:
- no new stable identifiers after a bounded number of attempts;
- a known page or record boundary has been reached;
- the control is no longer available;
- the expected target inventory is complete; or
- the workflow reaches a documented safety limit.
A ten-minute browser session that discovers no new valid records has consumed capacity without increasing coverage.
Isolate slow page classes
Do not let a small set of interaction-heavy pages occupy every browser worker. Partition them by target, template, workflow or priority so faster rendered pages can continue.
Keep retry queues separate from new work. Otherwise, a structural failure can repeatedly consume the same constrained capacity.
Treat retries as browser demand
Retries are not free capacity.
Track retry amplification:
retry amplification =
  total rendered attempts / accepted rendered pages
A value of 1.00 means each accepted page required one attempt. A value of 1.25 means the browser performed 25% more attempts than the accepted output alone suggests.
Classify failures before retrying:
- temporary navigation or network failure;
- target rate limiting;
- missing required state;
- access or challenge page;
- selector or workflow failure;
- browser crash; or
- downstream validation rejection.
Retry only conditions likely to change, use bounded backoff and quarantine persistent structural failures. Adding browser workers while retries are amplifying load can make the bottleneck worse.
Add capacity only after the workflow is efficient
More browser capacity is justified when:
- browser rendering is demonstrably required;
- the stepped test shows useful throughput still rises at higher capacity;
- page correctness remains stable;
- target request budgets allow the additional rate;
- retry amplification is controlled; and
- downstream systems can accept the increased output.
Retain operational headroom. Running continuously at theoretical maximum leaves little room for slow pages, retries, worker replacement or downstream delays.
For self-managed systems, separate browser pools by resource profile and failure domain. For managed scraping platforms, use their job-capacity controls while continuing to measure accepted throughput and data quality.
Apply the model in Web Scraper Cloud
Build and validate the sitemap in the Web Scraper browser extension, then test the same workflow in Web Scraper Cloud.
Web Scraper provides two Cloud drivers:
- Fast extracts from the HTML returned by the website without executing page JavaScript.
- FullJS loads the page in a browser environment, executes JavaScript and supports interaction-dependent workflows.
The driver documentation describes Fast as roughly twice the speed of FullJS. Treat that as a platform-level guideline, then compare the actual records, required-field completion and page outcomes for your sitemap.
Use Fast when the initial HTML contains all required fields and navigation links. FullJS is required when the sitemap uses scrolling, Element Click, Website State Setup, click-based pagination or pagination links derived from scripts.
A practical optimisation process is:
- Test representative URLs with FullJS and record the expected output.
- Check whether the same sitemap is eligible for Fast.
- Compare record counts, required fields, identifiers and representative values.
- Keep Fast only if it produces an equivalent valid dataset.
- Split browser-dependent and Fast-compatible page types into separate sitemaps or jobs when necessary.
- Calibrate page-load delays and interactions against actual data readiness.
- Monitor failed, empty and no-value pages alongside accepted output.
Web Scraper Cloud already avoids loading images while scraping, reducing unnecessary page-load work. It also manages browser execution, retries, proxies and job infrastructure. You therefore do not need to operate a browser fleet, but driver selection and sitemap design still determine how much rendering work the dataset requires.
Cloud parallel tasks represent scraping jobs that can run simultaneously. Additional jobs queue when no task is available, while sufficiently large jobs can also be split internally when capacity is available. Do not interpret job queueing alone as proof of browser saturation. Compare job duration, page outcomes, validated records and the proportion of work assigned to FullJS.
Use data-quality controls to monitor minimum record counts, failed and empty pages, and required-field population. Faster execution is useful only when it preserves the intended dataset.
Browser-bottleneck review checklist
Before increasing browser capacity, confirm that you have:
- separated queue, navigation, readiness, interaction, extraction and validation time;
- measured accepted pages rather than completed browser commands;
- compared median and tail browser occupancy;
- calculated attempts and slot-seconds per accepted page;
- ruled out target rate limits, access pages and downstream backlogs;
- tested concurrency in controlled steps;
- checked whether required data exists in the initial HTML;
- separated Fast-compatible and browser-dependent page types;
- removed unnecessary interactions and fixed delays;
- bounded scrolling, pagination and variant expansion;
- classified and capped retries; and
- confirmed that data quality remains stable as throughput rises.
The key scaling decision is not how many browsers can be launched. It is how little browser work is required to produce one accepted page.
Test the smallest reliable browser workflow first, then run it without managing the browser infrastructure yourself.